…And the winner is Occupied Sustainable!
Gas and Electric Comparisons 2009-2010
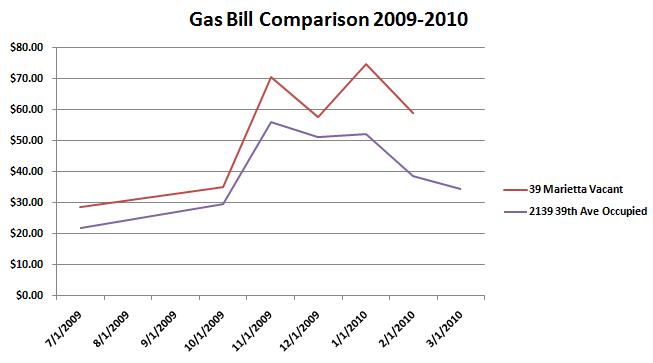
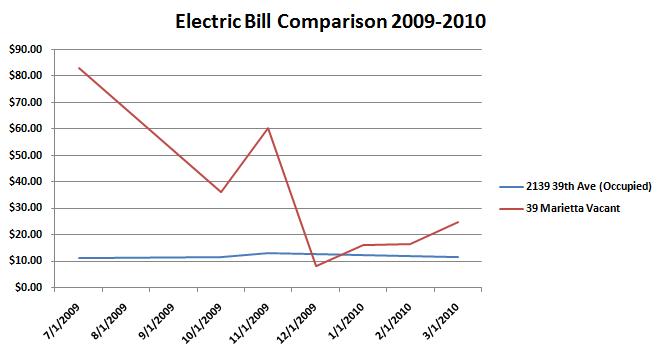
Hey, Andy here with another post – After analyzing months of PG&E bills from two houses, I put them into excel in order to compare their data. Below you will see a graphical comparison of monthly gas and electric bills between a house on Marietta Drive that is unoccupied and the sustainable house on 39th Ave occupied by a family of four…(To enlarge the graphs, click the image)
As you can see, the house occupied on 39th Ave is constantly paying less for their gas each month, a result of its efficiently and sustainability.
You will see in this graph that the electric bill paid in the occupied house is far less than that of the vacant. The 39th Ave. household has very steady payments not because it uses less, but rather because it has more efficient installations such as high efficient insulation, energy star appliances, energy star lights, and energy star windows (just to name a few!).


 These numbers do not lie and show that sustainable changes do pay off!


{ 1 comment… read it below or add one }